# Stats by player
Allows you to choose a player of the circuit in which to check the data. In this option you can select two types of view that offer different information: **Graphs** or **List**.
## **Graphs**
Stats by player
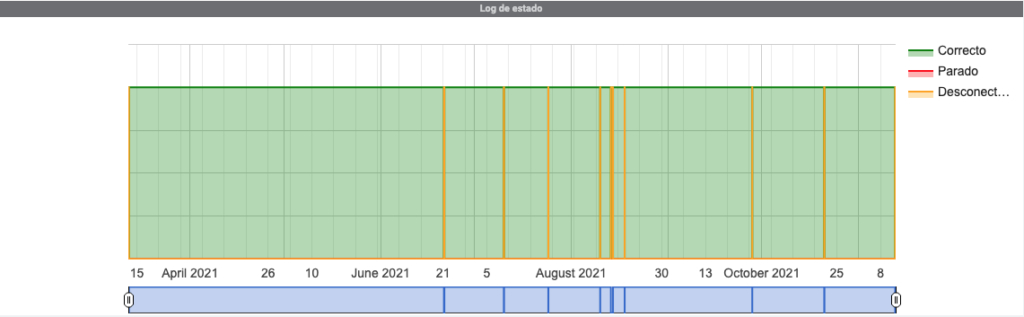
They provide, in addition to passes of content broadcast at each broadcast point, a history of data traffic (bandwidth use) and the connection status of the equipment (**Correct / Stopped / Disconnected**). You can also select a specific day to display the information.
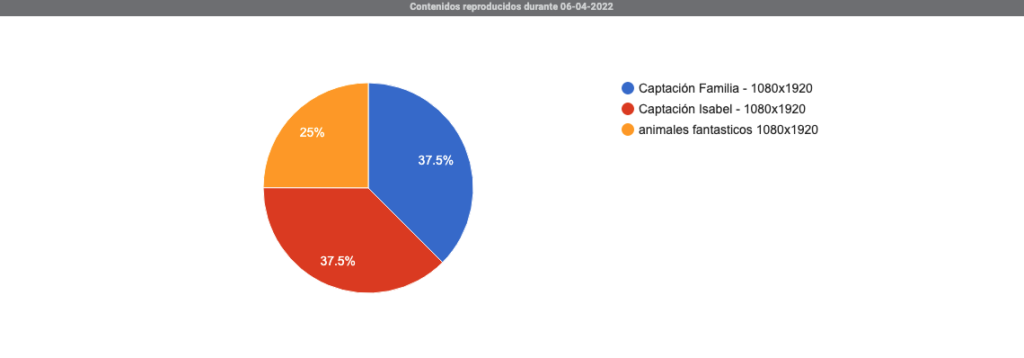
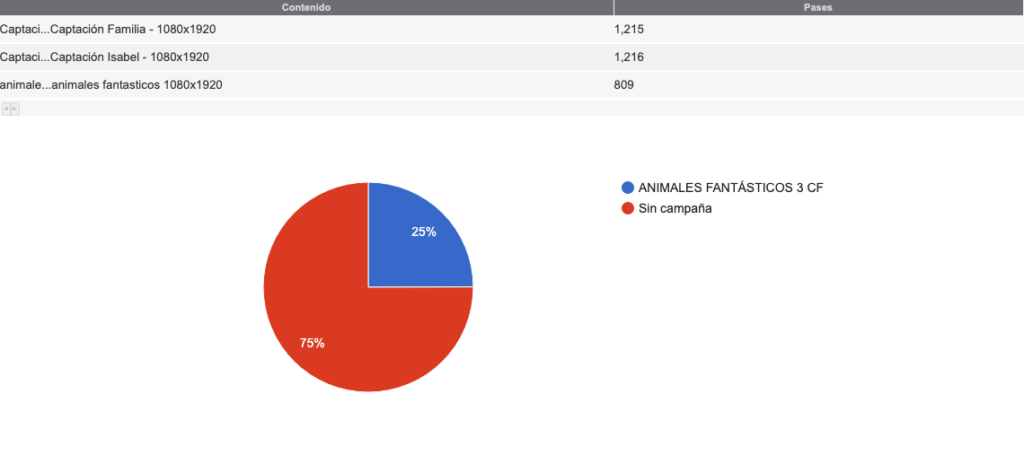
In the first place, it will show us by percentages the broadcast by content and by campaigns.
Broadcasted contents
Contents by plays
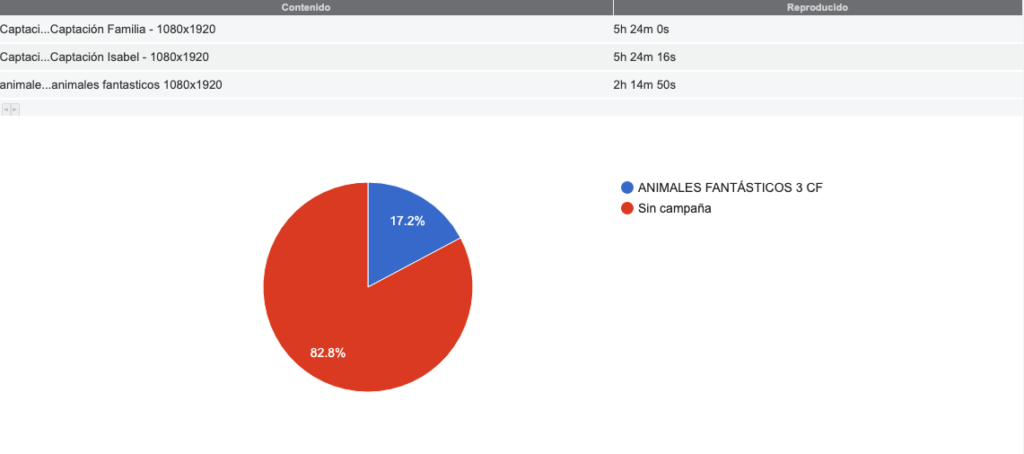
It will not only let you see the contents reproduced by the number of passes, but also by the broadcast time.
Duration
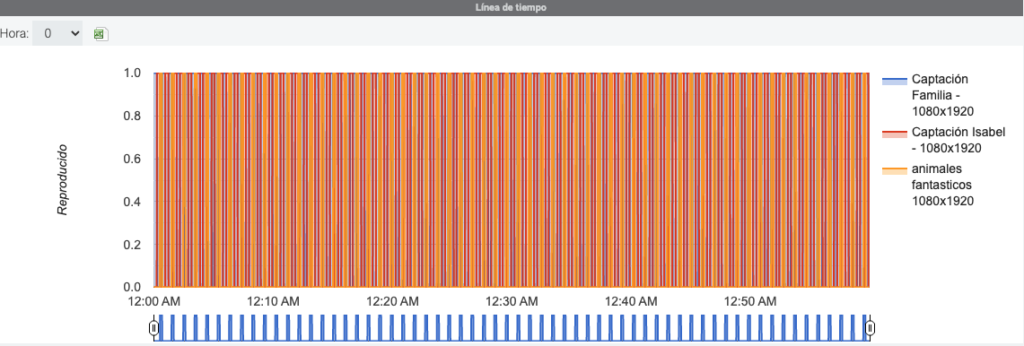
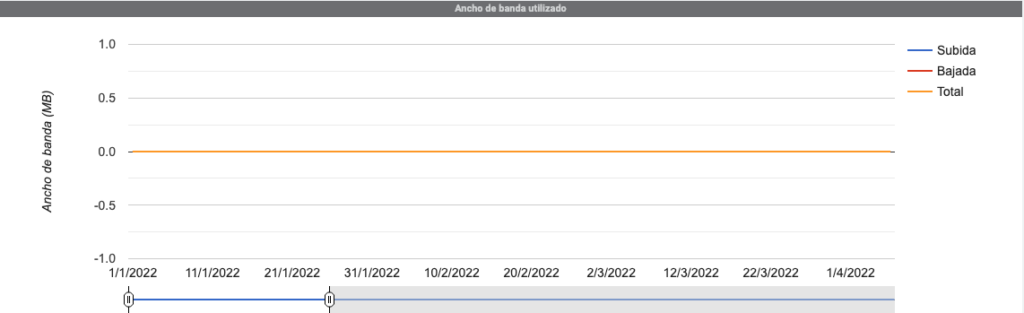
Finally, we will have a timeline, a bandwidth graph and a status log.
Timeline
Bandwidth
Status log
## **List**
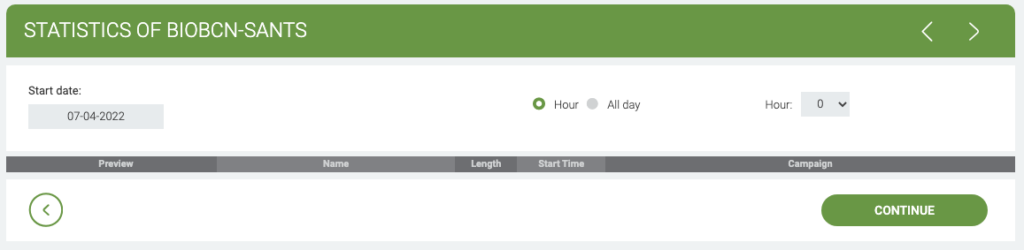
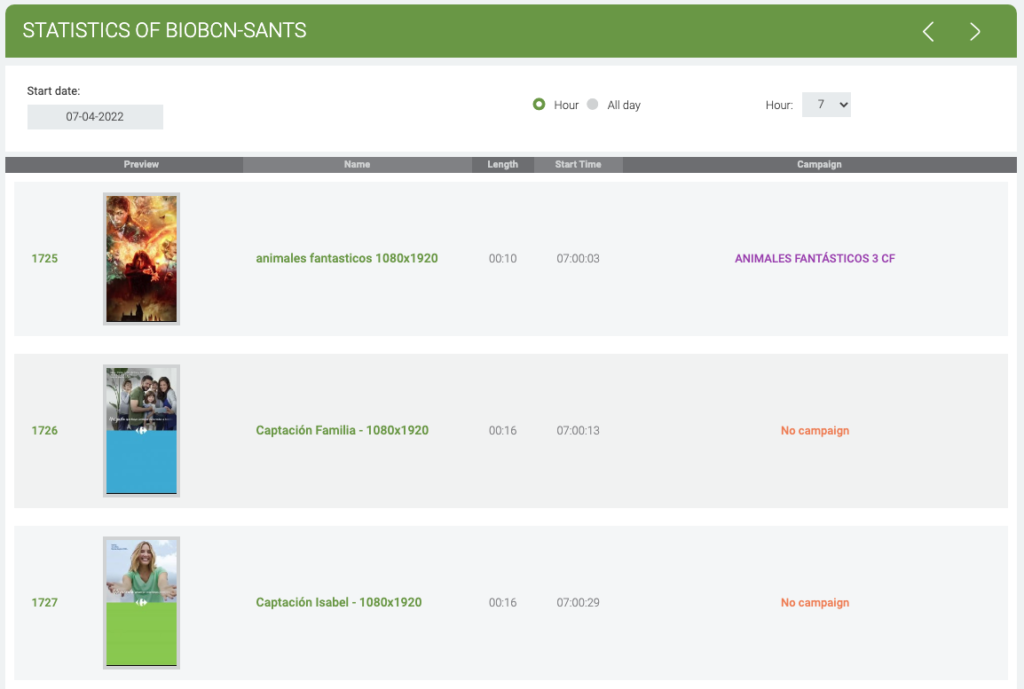
Firstly, it will allow us to select a specific day and time to see the content in that player in order of broadcast.
Stats
Firstly, it will allow us to select a specific day and time to see the content in that player in order of broadcast.